Simple examples - Statistics
This notebook is just a small reference on how to request OSM statistics via the ohsome-API.
Statistics:
features length for single timestamp
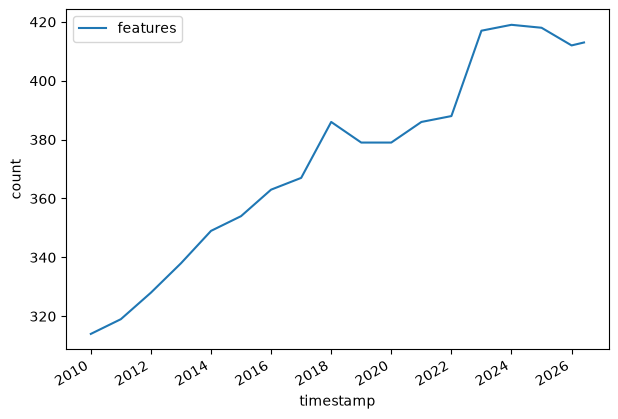
features count for time series
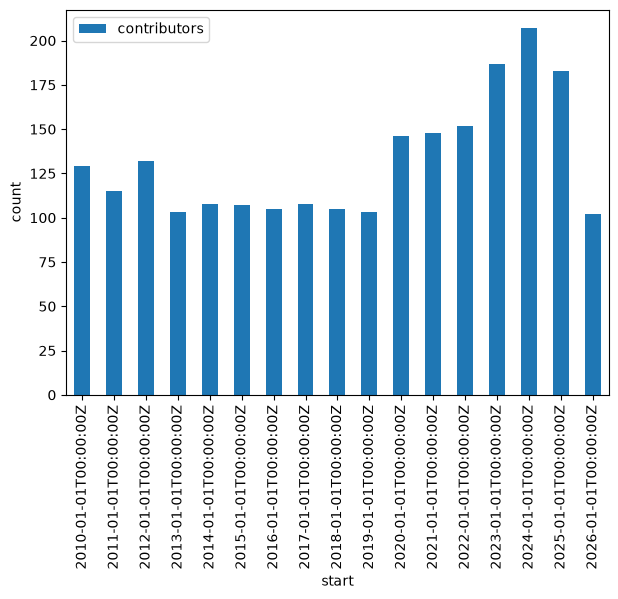
contributors count for time bins
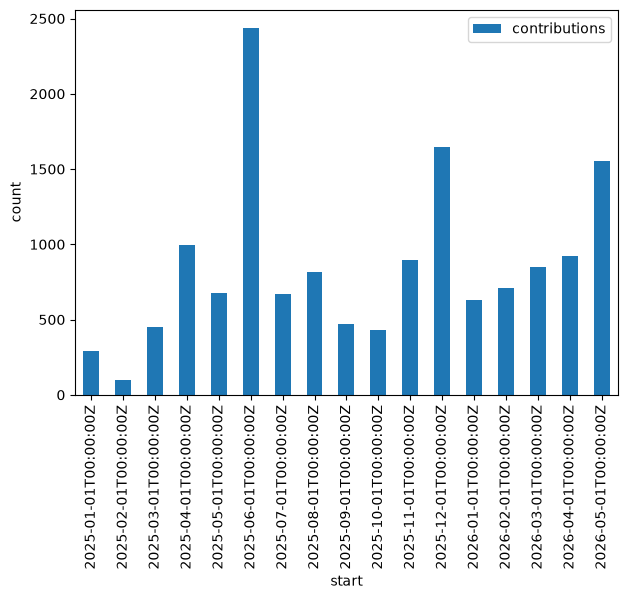
contributions count for time bins
import os
from io import StringIO

import httpx
import matplotlib.pyplot as plt
import pandas as pd
OHSOME_API_URL = os.getenv("OHSOME_API_URL", "https://api.heigit.org/ohsome-api/v2-rc")
OHSOME_API_KEY = os.getenv(
    "OHSOME_API_KEY", ""
)  # insert your api key as env or default value here
Features Length Single Timestamp
response = httpx.post(
    OHSOME_API_URL + "/stats/features/length.csv",
    json={
        "aoi": [8.6275437, 49.3727921, 8.7545042, 49.4385023],
        "filter": "highway=residential and geometry:line",
        "time": "latest",
    },
    headers={"authorization": OHSOME_API_KEY},
)

df = pd.read_csv(
    StringIO(response.text),
    delimiter=";",
    header=3,  # skip first 3 rows with metadata
)

display(df)
| timestamp | value | |
|---|---|---|
| 0 | 2026-08-21T21:59:59Z | 242452 |
Features Count Time Series
response = httpx.post(
    OHSOME_API_URL + "/stats/features/count.csv",
    json={
        "aoi": [8.6275437, 49.3727921, 8.7545042, 49.4385023],
        "filter": "highway=bus_stop and geometry:point",
        "time": {"start": "2010-01-01", "end": "2026-06-01", "interval": "P1Y"},
    },
    headers={"authorization": OHSOME_API_KEY},
)

df = pd.read_csv(
    StringIO(response.text),
    delimiter=";",
    header=3,  # skip first 3 rows with metadata
)

df["timestamp"] = pd.to_datetime(df["timestamp"])


fig, ax = plt.subplots(figsize=(7, 5))
df.plot("timestamp", "value", ax=ax, label="features", ylabel="count")
plt.show()
Contributors Count Time Bins
response = httpx.post(
    OHSOME_API_URL + "/stats/contributors/count.csv",
    json={
        "aoi": [8.6275437, 49.3727921, 8.7545042, 49.4385023],
        "filter": "highway=* and geometry:line",
        "time": {"start": "2010-01-01", "end": "2026-06-01", "binSize": "P1Y"},
    },
    headers={"authorization": OHSOME_API_KEY},
)

df = pd.read_csv(
    StringIO(response.text),
    delimiter=";",
    header=3,  # skip first 3 rows with metadata
)

fig, ax = plt.subplots(figsize=(7, 5))
df.plot(
    "start",
    "value",
    ax=ax,
    kind="bar",
    label="contributors",
    ylabel="count",
)
plt.show()
Contributions Count Time Bins
response = httpx.post(
    OHSOME_API_URL + "/stats/contributions/count.csv",
    json={
        "aoi": [8.6275437, 49.3727921, 8.7545042, 49.4385023],
        "filter": "building=* and geometry:polygon",
        "time": {"start": "2025-01-01", "end": "2026-06-01", "binSize": "P1M"},
    },
    headers={"authorization": OHSOME_API_KEY},
)

df = pd.read_csv(
    StringIO(response.text),
    delimiter=";",
    header=3,  # skip first 3 rows with metadata
)

fig, ax = plt.subplots(figsize=(7, 5))
df.plot("start", "value", ax=ax, kind="bar", label="contributions", ylabel="count")
plt.show()